by R. Grothmann
On US government sites, sunspot data can be found back to 1749. The data are already smoothed out with one value for each month. We like to use these data to compute the well known 11 year frequency of high sun activity.
I saved the data into a file as they were.
>data := readmatrix("sunspot.dat")';
The data format was (per line)
year month spots
First, let us extract the time and the number of spots.
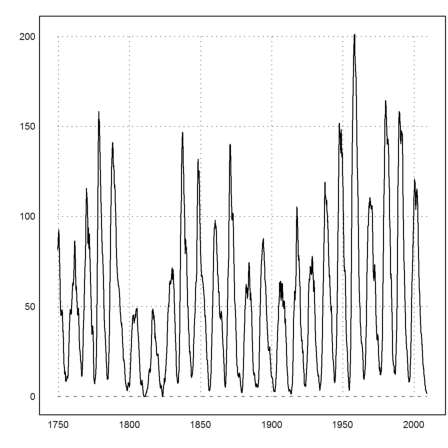
>years := data[1]+data[2]/12; spots=data[3];
>plot2d(years,spots):
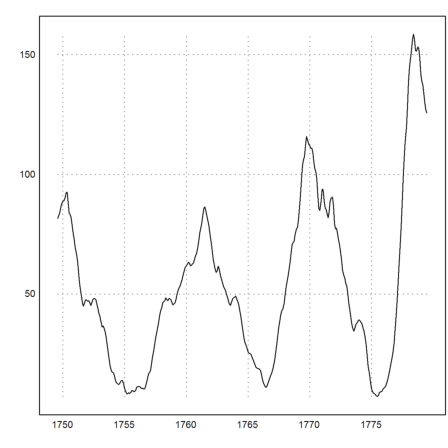
Here is a closer look at the first 30 years.
>n=30*12; plot2d(years[1:n],spots[1:n]):
We wish to determine the average frequency. To do this, we use the Euler matrix language. First we determine at which indices the number of spots passes 25.
>n=cols(spots); is=nonzeros(spots[1:n-1]<25 && spots[2:n]>=25);
Then we throw away those indices, where the time is not long enough.
>is=is[nonzeros(differences(is)>60)]|is[-1];
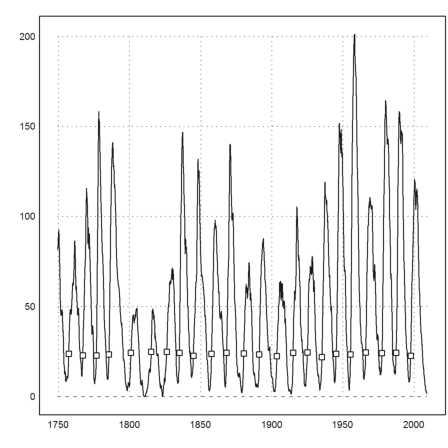
Check with a plot.
>plot2d(years,spots); plot2d(years[is],spots[is],points=1,add=1):
Now, we compute the mean number of years between these events.
>mean(differences(is))/12
10.9242424242
We like to try a Fourier analysis of the frequencies. However, the number of data is not good for a fast Fourier transform, since it contains the factor 173. A close and very good number is 3*2^10.
>cols(data), factor(cols(data)), n=3*2^10,
3114
[2,  3,  3,  173]
3072
So we take only the first n data.
>spotsn=spots[1:n]; yearsn=years[1:n]; a=yearsn[1], b=yearsn[-1],
1749.58333333
2005.5
The following function does a frequency analysis of data, which are evenly spread over a given time.
>function analyze (data,time) ...
 n=cols(data); // number of data
 c=abs(fft(data))[2:n/2]; // absolute value of FFT at f[i]
 f=(1:n/2-1)/time; // frequencies f[i]
 return {c,f};
 endfunction
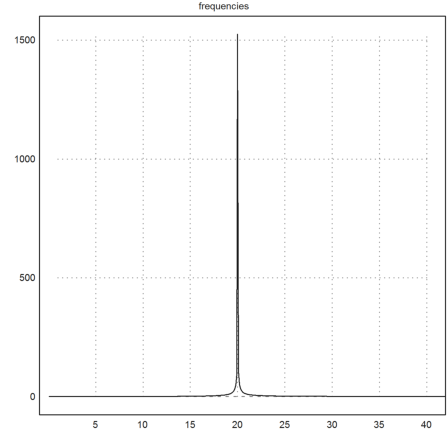
For an example, we try a signal of frequency 20 over 10 seconds.
>t=linspace(0,10,n-1); s=sin(20*2*pi*t);
Analyze it.
>{c,f}=analyze(s,10);
And plot the frequencies.
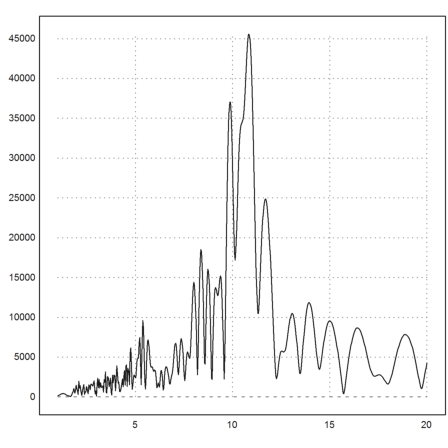
>plot2d(f,c,a=1,b=40,c=0,d=max(c),title="frequencies"):
Now the same for our data.
>{c,f}=analyze(spotsn,b-a);
This time, we plot the wave length, which is 1 over the frequency.
>plot2d(1/f,c,a=5,b=20,c=0,d=max(c),title="wave lengths"):
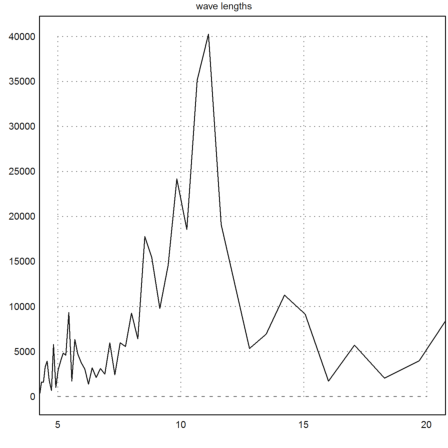
We can clearly see the wave length of 11 years.
For a test, we can also try a continuous Fourier transform of the data. This will work for the original spots data.
>function map ft(w) ...
 global a,b,spots;
 t=2*pi*(b-a)/w*(1:cols(spots))/cols(spots);
 return abs(sum(exp(-I*t)*spots))
 endfunction
The following will take only a little longer.
>plot2d("ft",1,20):